I love using visuals in marketing, but I haven't personally used infographics. So today, I am thrilled to introduce Ashley Kimler who explains how to use infographics as part of your book marketing process.
It’s time for you to promote your book. Sadly, when it comes to being seen, authors don’t have it easy because the market is saturated and competition is ferocious. It’s nearly impossible to estimate how many other writers you’re up against; what I do know is that 81% of Americans want to write a book. No other industry exists today that is so desperately sought-after.
Now that you’re an aspiring authorpreneur, and your book is on the shelves (or at least en route to publication), you need to do everything you can to optimize your chances of success. You know that visual content is critical for building a fanbase and generating online book sales. But, what kind of visual content are you creating and how are you leveraging it?
Infographics are one of the most powerful tools to build your author brand.
The problem is that not many writers are aware of how to properly leverage them – most don’t have a background in online promotions, and the rest are learning right along with everyone else (as new technologies disrupt every tactic we seem to master). Here, you will learn precisely what it takes to leverage infographics for long-lasting, effective book marketing.
First, Identify and Get to Know Your Target Reader
The most common trap I see authors falling into is believing other writers are their target reader or everyone in the world will want to read their book – they follow every author they can find on Twitter and post links to their new book sales page to writers’ groups on Facebook and LinkedIn. In some cases (when you create books about writing, book marketing, or other relevant topics), authors are your best reader. Unfortunately, 99% of the time they aren’t. The more targeted and specific your campaigns are, the more successful they will be.
Joanna wrote a brilliant post back in 2013 about how to identify your target reader; here, she stated how to begin your discovery with self-exploration and provided a framework for composing a clear vision of precisely who really wants to read your work.
Once you know who your target reader is, spend some time getting to know them (if you don’t already). Then, find out where they hang out online and start spending time there.
- Specific social media platforms
- Online forums
- Facebook and LinkedIn groups
- Websites and blogs
As an example, let’s pretend that you’ve written a nonfiction book about education reform from your perspective as a former high school English teacher. Your ideal readers are probably other high school teachers, correct? So, where will you find them online? They might hang out in the same places you do: the same social media sites, forums, groups, and blogs.
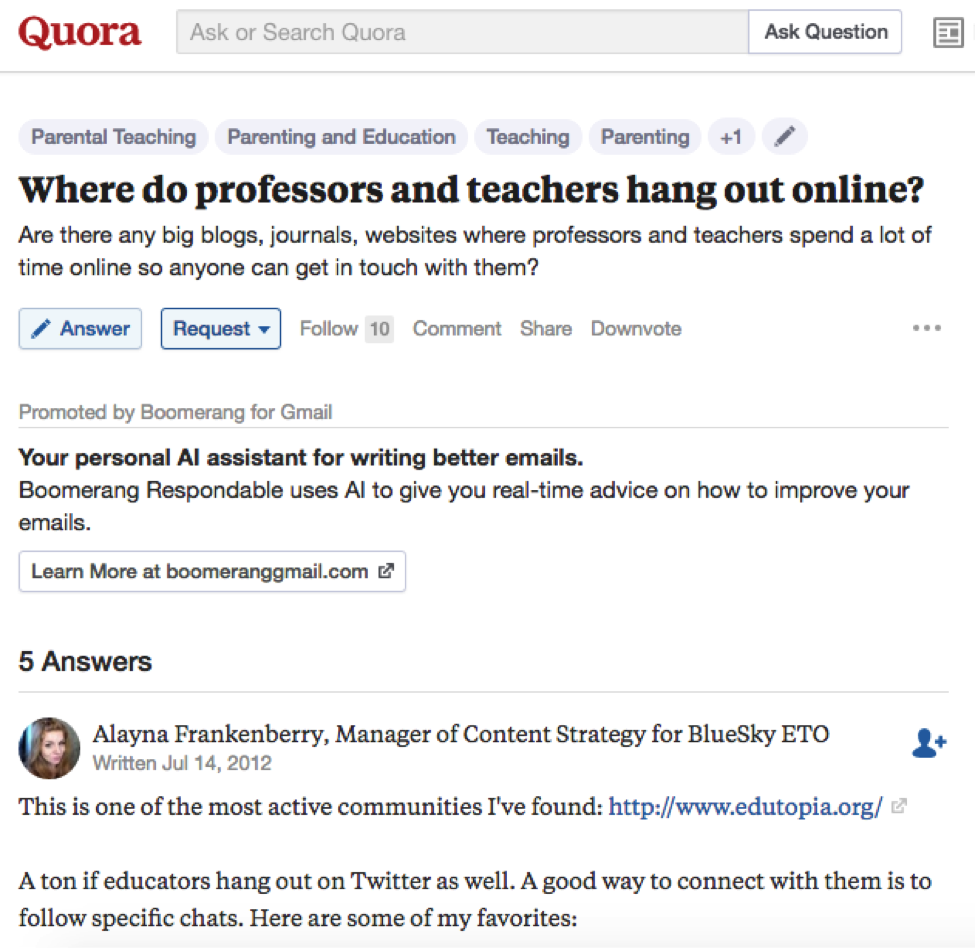
Next, Find Out What Your Potential Readers Want & Need
Spend time observing your prospective reader members as they engage with one another, and you will organically discover their language, tone of voice, and desires. While you’re perusing these pages, watch for trends. Specifically, seek out questions and problems that your potential readers have. Create a list of common issues and use it to generate topic ideas – HubSpot’s Topic Idea Generator is helpful at this stage.
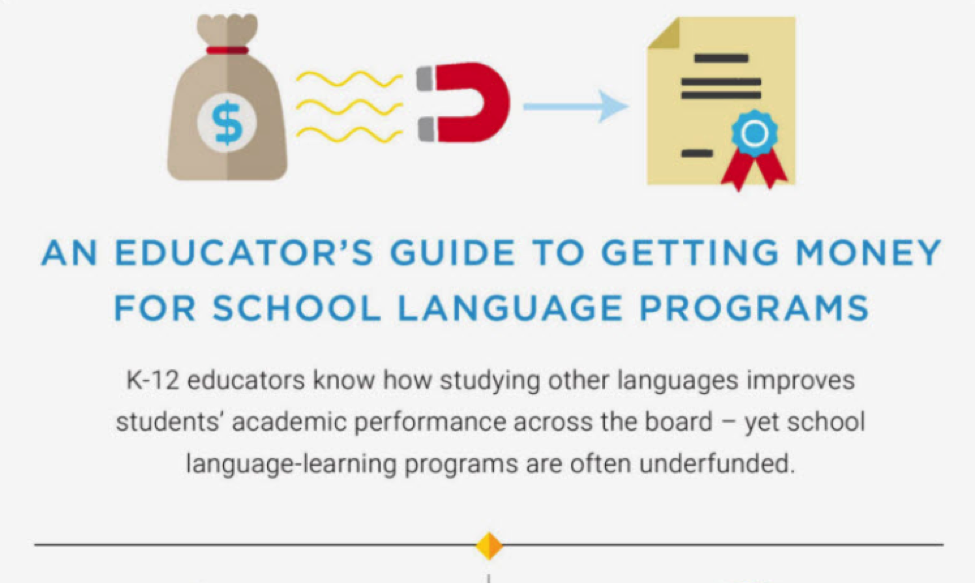
If your target reader is high school teachers, a common problem could be locating funding for projects that the school won’t cover. In this case, you could think about creating an infographic like this.
Then, Assemble Your Outline and Strategy
When your topic or list of topics is ready, it’s time to compile research. Gather the information you need to create a helpful infographic and determine how, when, and where you will share it. Planning in advance will lead to efficiency.
- How much information should you include? – Do you want to pack your infographic with primarily text or images? What seems to appeal to your target reader? Find out what infographics others have created — share them with your reader and monitor the results to determine which styles work best.
- Which social media sites will you share on, and what type of infographics work best on these sites? – If you’re going to share on Facebook, Twitter, or Instagram, for example, you may want to create a small, landscape-oriented infographic or crop a tall image down and include a link to the larger infographic. On the contrary, you should be able to share just about anything on Pinterest (though portrait-oriented images are the most effective here). Optimize your final product for the platform(s) you will be sharing on.
- List all potential traffic sources for your image – Of course, everyone wants to share on social media, but there are many other places to promote your infographic. Create a list and keep it on-hand to reference after you hit “publish.”
Here are some ideas:
– Your email newsletter
– Someone else’s email newsletter
– Infographic review websites
– Image hosting websites (Flickr)
– Slideshare
– Niche-specific databases
– Informational directories
- Where will you host the infographic? – The best place to host your infographic is on your own blog on your author or book website. This way, when readers view your page, they have access to all of your information. Hosting your content on a site that functions as an informational resource for your readers is the best way to generate leads. No matter where you host, make sure that the reader can easily find information about you and your book.
Tip: When creating an author website where you plan to actually sell copies of your book, be sure to use a content management system optimized specifically for book and ebook sales. Host infographics and other promotional content primarily on your blog.
Can you use infographics for book promotion if you don’t yet have an author website?
As a new children’s Kindle book author with another full-time job and a currently unpolished print version of my story, I do not have an author website (too much of my time is spent on other projects to warrant creating a new site at this time). For now, I use social media as my book’s primary lead-generation channel. Though I can’t say mine is the number-one method to run a book promotion campaign, I will go out on a limb and guess that countless authors are without a branded site for one reason or another.
If you don’t have a website, yes, infographics are still an effective promotional tool. If you’re building a brand without your own website, you can host your infographic on the platform you use to create it (we will delve into the best platforms soon). Just make sure the infographic is public, your profile is complete, and you include a visible link to your book sales page.
Alternatively, you can create infographics for someone else’s blog – help another artist or business build their brand. The site you post your infographic on doesn’t have to be that of another author; it can be a blog in any niche your target reader is interested in. You just need to find a blog that accepts guest posts and reach out to the admin for negotiation.
Josh Katz, author of “Speaking American: How Y’all, Youse, and You Guys Talk,” created an infographic for the New York Times that went viral: Ted Cruz as Beowulf: Matching Candidates With the Books They Sound Like. It’s no accident that his literary project is mentioned in the author bio for the post.
After that, Choose Your Design Platform
You no longer have to be an Adobe master to create attention-grabbing designs; there are high-quality, free and inexpensive tools you can use. Here are a few of the most popular infographic-creation tools.
Canva
Canva is a favorite because it provides the most freedom and it’s free. I actually used this tool to design my entire book. Though it would have been more efficient to hire a book designer, I was satisfied with the end result. Canva has pre-existing templates for infographics and paid pro features to enhance the design experience.
Piktochart
Before becoming comfortable with Canva, Piktochart was my infographic-creation tool of choice. There are free templates here as well, but there’s a catch – if you don’t pay, you get the Piktochart logo at the bottom of all of your designs. Fortunately a premium account starts at only $15 monthly.
Infograph.ly
Unless you are comfortable with low-quality infographics with no downloads (no ability to host on your own website), this tool is a bit more expensive than the others. It costs $39 monthly for 50 infographics and $49 for an unlimited number of lossless infographics and downloads. This platform made the list because it’s so easy to use: You choose the content and this tool spits out a high-quality infographic for you. This is a great option if you don’t have a lot of time to commit to book promotions.
Of course, if your budget permits, you can also hire a professional infographic designer.
Finally, Create a Captivating, Helpful Infographic
When your research is done and your plan set, it’s time for the fun part – designing your infographic. Depending on your topic, reader, and promotional channels, your needs will vary. When designing your infographic, no matter the reader, here are the five basic elements that unite to create a powerful infographic:
1. A catchy, engaging headline
Your infographic headline will be the piece that initially draws readers in. Your headline should be “clickable.” Use CoSchedule’s Headline Analyzer to fine-tune your potential headlines.
2. Effective balance of whitespace, text, and imagery
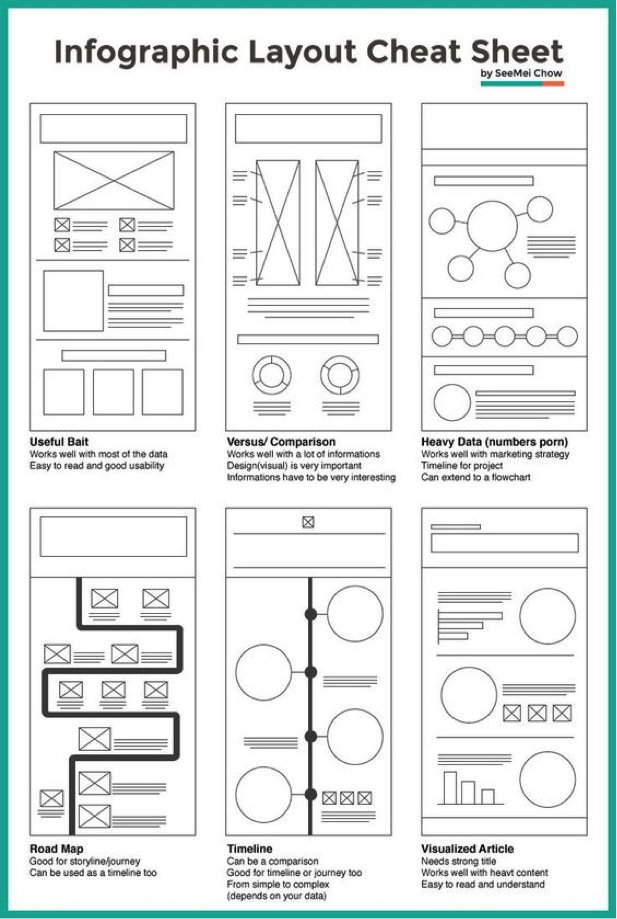
3. Power words
Now you know how infographics work to promote your book. Identify and learn about your target reader. So many articles online are flooded with weak words. Rise above and use power words throughout your infographic to convey your message.
4. Relevant typography
How can typography be “relevant?” The font you use speaks to readers’ emotions. Your typography should convey the same emotions as your topic.
5. Branding
Whether you include a logo, your name, the title of your book, or your publishing company name, branding is helpful. If someone shares your image on their website and forgets to link back to the original source or the link is somehow broken, an unbranded infographic will lose its purpose (to generate leads, build authority or sell books). A branded infographic provides value no matter where it is shared.
Conclusion
Now you understand how infographics work for book promotion. Pinpoint and learn about your target reader, then discover what problems and questions they have. Choose infographic topics that help potential readers that may be attracted to your book. Explore design platforms to create your final product or hire someone to create a promotional tool with a catchy, engaging headline, balanced white space, text, and imagery, power words, relevant typography, and author or book branding.
Once your infographic is complete, it’s time to share it with the rest of the world.
Have you used Infographics to promte your book? Please leave your thoughts below and join the conversation.
View Comments (7)
Creating an infographic is on my to-do list, especially as an active Canva user, so this post is a great incentive. I also appreciate the reminder about defining the target audience and tips for finding WHERE and HOW that group interacts on social media.
Cat, I'm glad this sparked your creativity. Please share your infographic(s) when finished!
I am now going to be thinking of ways I can incorporate infographics into my website. I immediately have a couple of ideas, but since I write fiction I will need to work it into my blog "extras" that is not related to my novel. I appreciate the template to help jumpstart that visual creativity. The wheels are already turning...
C.A. -- I would love to see the infographic(s) you come up with. Please share!
Thanks, Ashley!
Branding. Branding. Branding.
I'm glad you included the fifth point. I've seen so many excellent infographics on social media, but the original URL gets lost in the shuffle from one share to another. Identifying who created the image is a huge leap toward recognition.
Marketing experts say that people must see an ad seven times before they take action. I imagine the same statistic would apply to infographics.
I appreciate your thoughtful feedback, Kathy. I don't know if there's a study, specifically about infographics, that finds how many times people look at them before they take action. That's an interesting thought. I agree that the same (or at least similar) psychology applies to both. I will keep my eyes peeled for more information. Thank you.
Great post on Infographs. As a paranormal and horror book author, I am pleased to have discovered yet another great source of book promotion and brand building which I had hitherto been unaware of. My only problem now is trying devise what sort of infograph I can build, and what statistics it should show, in regard to the horror and paranormal genre. Any suggestions to this effect would be immensely grateful, guys. Cheers